Analytics & Research

Onchain data, built for analytics & research.

Purpose-built onchain data for dashboards, research, and blockchain analysis. Wallets, transactions, transfers, prices, and protocol events in one API. Unified across 100+ chains.
Built for
Analytics Teams
Research Labs
Dashboard Builders
Universities & Colleges

Use GoldRush as Your Analytics Data Layer

Clean, queryable onchain data across every major chain: wallets, transactions, transfers, prices, and protocol events, ready for the dashboards and reports you build.
Cross-Chain Data Aggregation
Analytics workflow

Cross-Chain Data Aggregation

Query balances, transactions, and metadata across 100+ chains

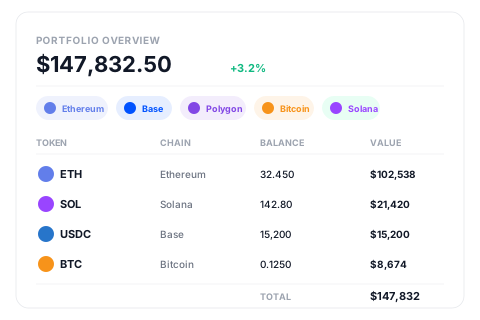
Aggregate wallet activity into unified views

Surface cross-chain flows, positions, and market signals

Build cross-chain dashboards and research views without per-chain integrations or custom normalization pipelines.

No per-chain API integrations
No custom data normalization
No manual cross-chain stitching
Research workflow

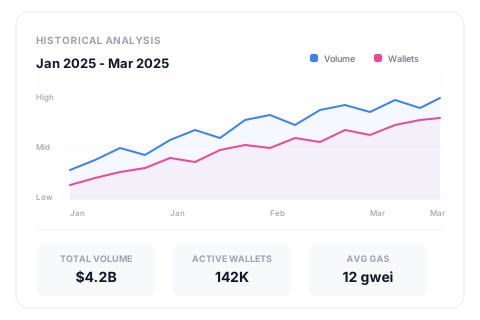
Historical Trend Analysis

Access historical token prices, balances, and activity snapshots

Query volume, usage, and gas trends over time

Backtest strategies and study behavior across full history

Run longitudinal analysis without archive nodes, manual backfills, or custom historical data stores.
No archive node maintenance
No custom price databases
No manual historical backfilling
Historical Trend Analysis
Real-Time Analytics & Dashboard Feeds
Dashboard workflow

Real-Time Analytics & Dashboard Feeds

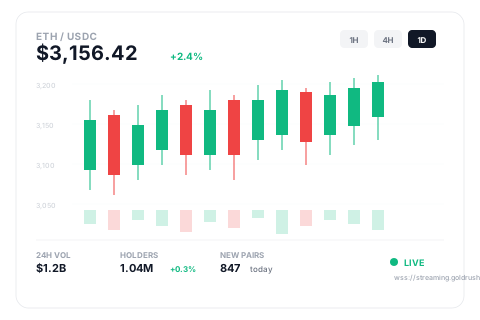
Subscribe to live swap events, wallet activity, and pair launches

Stream market and protocol events into dashboards and alerting systems

Power views that update continuously in real time

Deliver live analytics and dashboard updates without custom WebSocket infrastructure or event processing pipelines.

No custom WebSocket infrastructure
No manual event processing
No polling-based updates

Why Teams Choose GoldRush

01

Historical data to genesis

Full chain history for longitudinal analysis. No archive nodes or custom backfilling required.

02

Cross-chain in one call

Aggregate wallet and token data across 100+ chains through a single unified API.

03

Decoded, enriched blockchain data out of the box

Decoded events, fiat prices, token metadata, and labels included.

04

Real-time event streams

Live swap events, pair launches, and wallet activity via WebSocket. No polling required.

05

Pipeline API for warehouse sync

Stream decoded blockchain data directly into Postgres, ClickHouse, Kafka, or S3.

06

Built for analytics stacks and research pipelines

Query directly, stream continuously, or land data in your warehouse.

07

Research-ready historical datasets

Use consistent multichain data for longitudinal analysis, publications, and internal studies.
Extend Your Analytics Platform

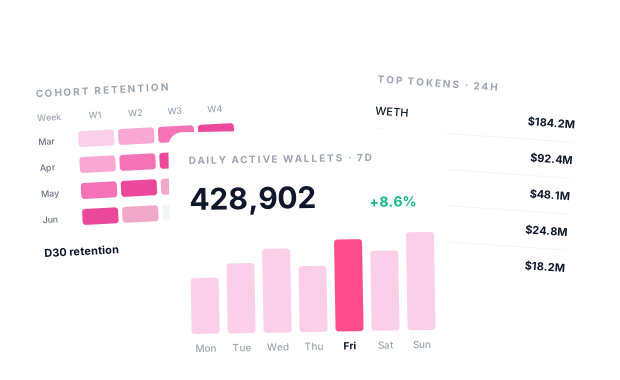
Beyond dashboards, model cohorts, attribution, and the onchain narratives your team is chasing.

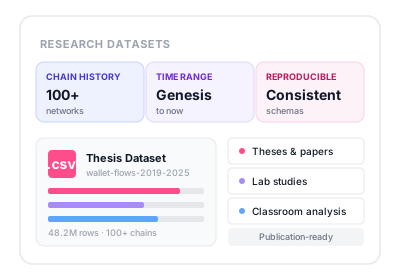
Academic Research Datasets

Academic Research Datasets

Build repeatable multichain datasets for theses, lab studies, classroom analysis, and published research.

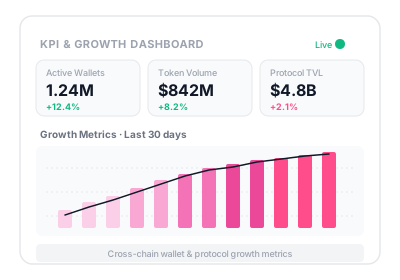
KPI & Growth Dashboards

KPI & Growth Dashboards

Track wallet activity, token usage, and protocol growth metrics across chains.

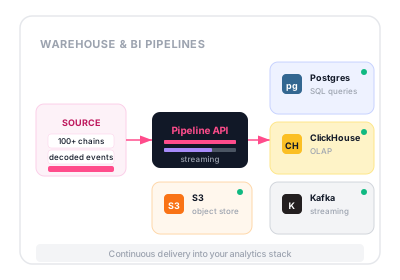
Warehouse & BI Pipelines

Warehouse & BI Pipelines

Continuously land structured blockchain data in Postgres, ClickHouse, Kafka, or S3 for downstream analytics.
↑ How to build it

From workflow to endpoint

Pick the workflow, then drop straight into the endpoint that powers it.

Built for Agentic Analytics Operations

01 / 02

Research Assistant Agent

Triggernew data slice or analysis request
Detectrelevant chain, wallet, or market pattern
Actgenerate a summary, highlight anomalies, or prepare a research view
02 / 02

Dashboard Watch Agent

Triggerunusual metric change
Detectactivity spike, outlier wallet flow, or liquidity anomaly
Actalert the analyst or annotate the dashboard

Turn Blockchain Data into Insights with GoldRush

Get your free API key and build production analytics in minutes.